|
Sometimes it is necessary to display data in the form of a framed table. An example of this type of report might be a price list. To create this type of report in FastReport just requires the enabling of frames for the objects located in the data band. Let's demonstrate several variants of frames with an example.
Create a report similar to this:
Place the “Text” objects side by side on the band and minimize the band’s height.
The first and the simplest type of table has full cell framing. To achieve this enable all frame lines (found in Frame.Typ property) for every object:
The next type of framing draws only horizontal or only vertical cell lines, again through the Frame.Typ property:
Finally, to draw only an external frame to the table the report needs a modification:
You can see that we have added two “Text” objects, one in the pageheader and one in the pagefooter bands. The appropriate frame lines for the objects along the edges of the data band have been enabled, resulting in the report looking like this:
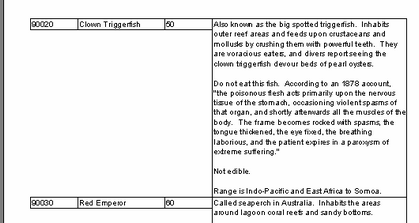
All these examples contained bands which had fixed sizes. How is it possible to display a table when the band is stretched? Let's explain how, by means of an example. Add a new field (multi-lined text from Bio.“Notes”) to our report. As you have already learnt, the “Stretch” property must be enabled both for this object and for the band in which the object is located so that the band height is altered, dependent on the size of the text in the “Text” object. The generated report looks like this:

This is a bit different from what we need - it looks nicer if the frames of the neighboring objects stretch as well. FastReport can solve this problem easily. Set the “StretchMode” property to smMaxHeight in the object inspector for all objects which are to be stretched and the FastReport core will first calculate the maximum band height and then “stretch” objects with stretch enabled to the bottom edge of the band. Because object frames stretch together with the object the report’s appearance changes:
|