|
|
|||||
|
|||||
|
|
|
As well as aliases, there is another way to help the report designer set more understandable names for DB fields and other information elements. A DB field name or any expression can be associated with a variable. To create and work with variables in FastReport, select the “Report/Variables...” menu item.
The list of variables in FastReport has a two-level structure. The first level simply contains the category and the second level contains the variable itself. This categorization of variables is convenient when the list of variables is very long. A variable list must contain at least one category, which means that variables cannot be located at the top level. Furthermore, category names cannot be included in reports, so each name within the list must be unique.
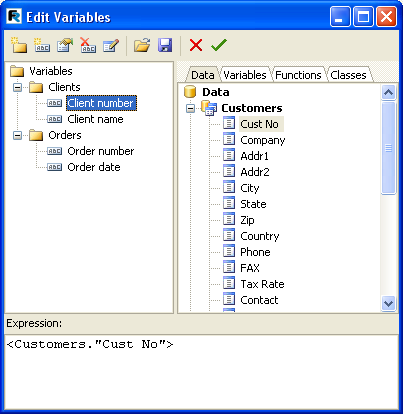
Let's illustrate the use of variables with the following example. Assume we have two data sources: the first is “frxDBDataSet1” with “CustNo” and “Name” fields and the second is “frxDBDataSet2” with “OrderNo” and “Date” fields. We can associate the following list of variables with the fields:
Clients
Client number
Client name
Orders
Order number
Order date
where “Clients” and “Orders” are two categories. Open the variables editor and create this structure by using of the “New category”, “New variable”, and “Edit” buttons. To link the variables to the DB fields select a variable and double-click on the required DB field in the right hand pane. The link to the DB field will be shown in the bottom pane. The variable is now associated with this expression so the value of the variable becomes the value of the expression. If necessary, the expression can be edited or modified manually and any FR functions or other variables can be used within it. Remember that categories must not be associated with any expression.

After the list of variables has been created, close the variables editor. Now we can insert the variables into the report. In contrast to DB fields, there are fewer insertion methods. We can either insert a variable into the object text manually by typing “[Client number]”, or we can drag a variable from the “Data tree” pane onto the report page, in which case switch to the “Variables” tab in this pane.
Let’s review what we have learnt so far
- A report design is composed of design pages
- Pages may contain FR objects, either placed on the page or within a band
- Bands are placeholders on the design page and control where the objects they contain appear on the output page(s) according to the band type
- “Text” objects contain the text we want to output in a given position, they can be multi-lined and may contain static text, data fields, variables, expressions or a combination of all of these
- Data type bands (Master, Detail, Subdetail etc.), when connected to a TfrxDbDataset, control the number of times these bands appear (rows) and, together with the report engine, determine the number of finished pages output by the report. Note: even though these data bands may have types like Master, Detail etc., this is only a place relationship of the bands' hierarchical position on the output pages(s). The actual data relationships are dependent on the table/query relationships within the connected frxdbdatasets. Each data band level requires a separate “TfrxDbDataset” or equivalent association.
|